Scraping data has vastly improved in Excel thanks to the new web connector.
The previous web connector in Excel relied on data on a page to be formatted as an HTML table. If not, it would not recognize it, making it very difficult to connect to and import into Excel.
Using the power of AI, Excel now interprets data on a page with a table-like layout and offers it as a suggestion. And if this fails, the Add Table Using Examples feature can be used to explain to Excel the data to scrape or extract. Let's look at a couple of examples.
Suggested tables
For this first example, we'll demonstrate how to import the list of best-selling books on Excel from Amazon UK.
The URL we will source the information from is: https://www.amazon.co.uk/gp/bestsellers/books/14227791/
The image of the web page here shows the list of books we want from the page. As you can see, the data is not in a table as there are no headers, but it is in a grid-like layout.
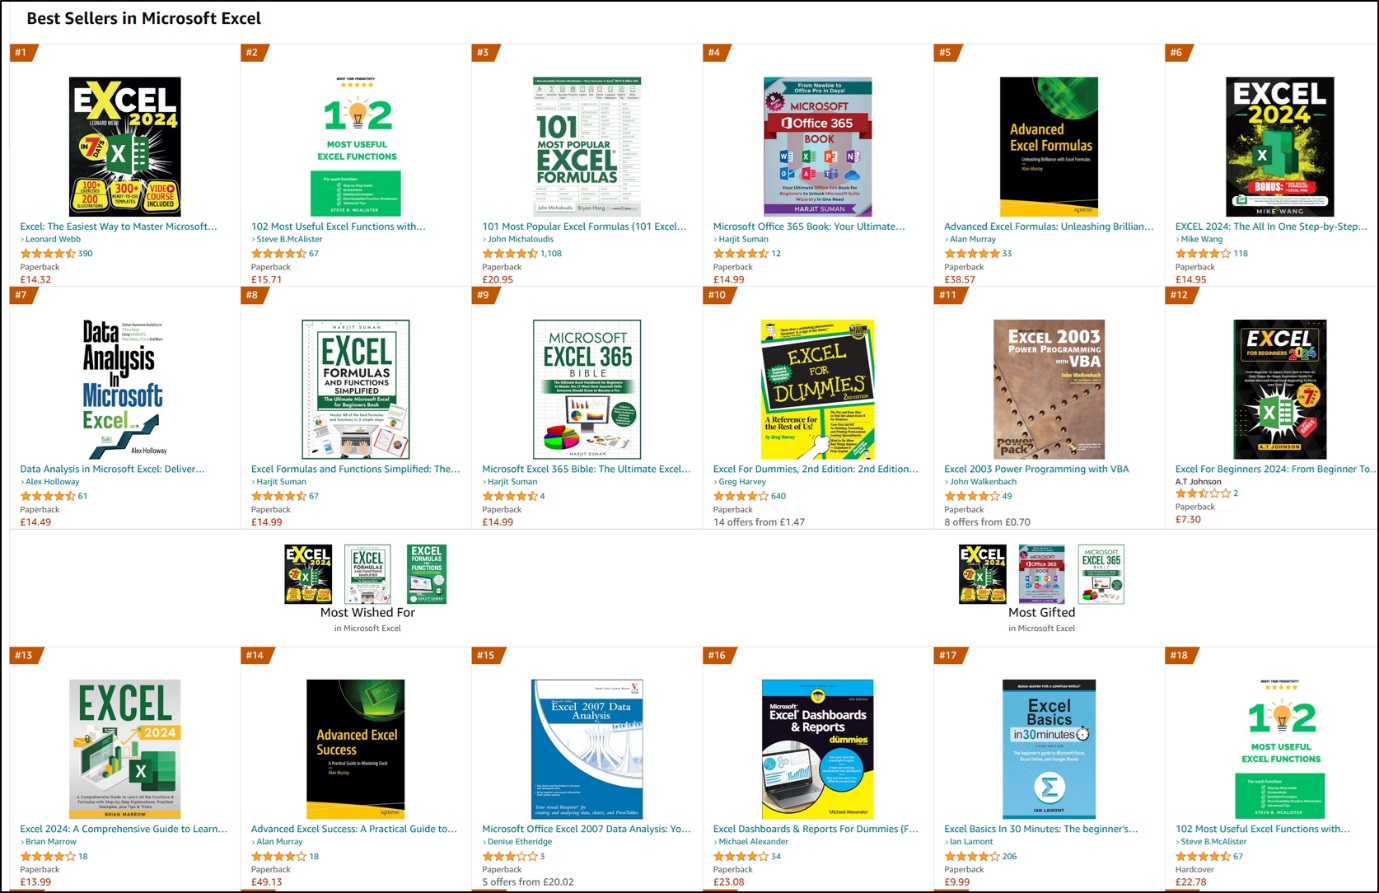
Amazon web page.
To get this data, click Data > From Web and type or paste the URL in the box provided in the From Web dialog.
Now previously in Excel, the Navigation window would appear offering different elements of the page to extract. For this URL, the old Excel finds a single table (Table 1), but it's not the table that we want, and it doesn't suggest any other tables.
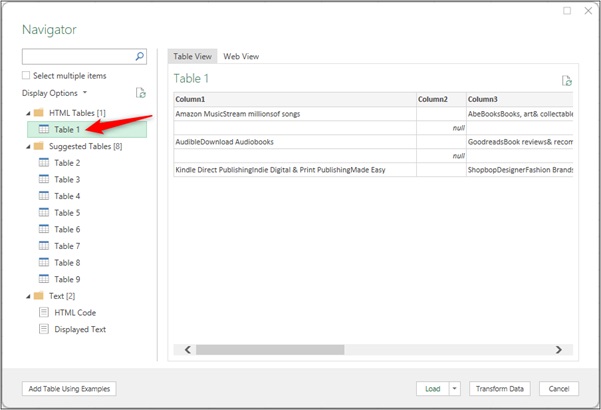
Cue the new version of the web connector! With this new version, the Navigator window shows the same HTML table as the old version (Table 1) as well as a few suggested tables.
Previously in Excel, only Table 1, the HTML table, would have been shown.
The first suggested table (Table 2) is exactly what we want, and the preview shows how the data on the web page has been organized into a table that is almost ready to load into Excel.
Despite not being an HTML table, Excel correctly suggests the content might be used as one.
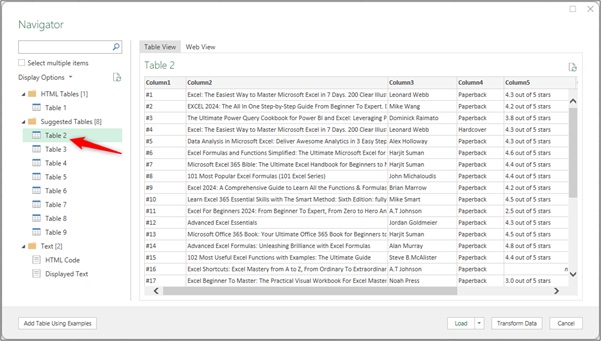
Select the table and click Transform Data to make further transformations of the data in Power Query before loading it into Excel.
Add table using examples
For times when your data does not appear as a suggested table, you may be able to extract it using the Add Table Using Examples feature. For this example, we will import the top 10 YouTubers by number of subscribers from the Social Blade website. The URL is: https://socialblade.com/youtube/top/100/mostsubscribed.
This is an image of the data that we need. This data looks like it is in a table - it even has headers, e.g., Rank, Grade, Username, etc.
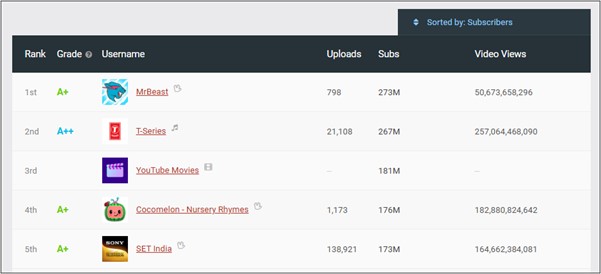
Social Blade web page.
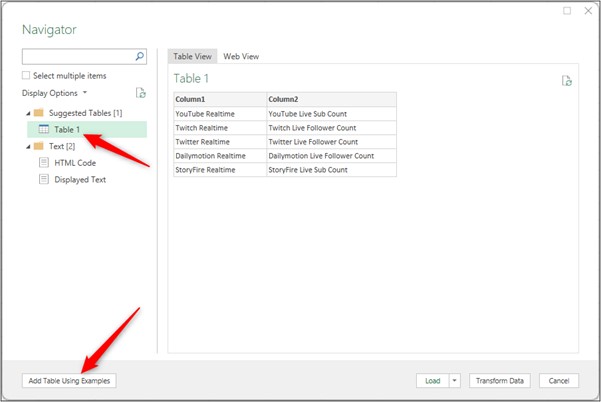
However, when we proceed to get data from the webpage, it is not recognized as a table by Excel in the Navigator window. None of the options provided in the window are the data that we want. So we will use the Add Table Using Examples button in the bottom left corner of the Navigator window.
In the Add Table Using Examples window that appears, the window is split in half, with the top half showing a preview of the web page and the bottom half allowing the entry of examples. Enter the data that you want to extract from the page. As you type, the feature will be analyzing the page to interpret the data that you need.
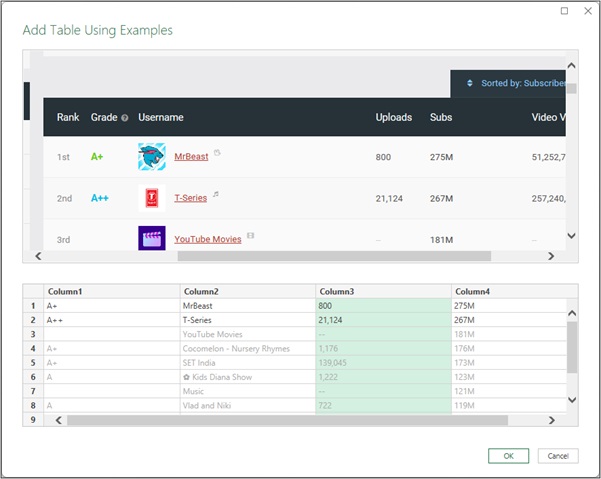
Here you can see that we have specified to extract only four columns from the data. Two rows of example data were entered, shown in darker type (MrBeast and T-series), and in the light grey font is a preview of other results based on these examples.
Click OK to add a custom table to the Navigator window. Click Transform Data to load the custom table into the Power Query Editor. Make further transformations as necessary and load the data into Excel.
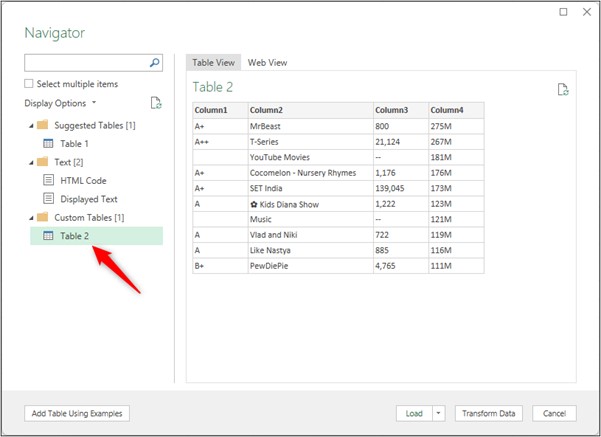
The custom table you've created can be loaded into Excel.
You can edit the custom table using the From Examples experience at any time by editing the required step in the Power Query Editor.
